Laffer Curve: How This Simple Economic Theory Could Transform Tax Policies
From Current Affairs Notes for UPSC » Editorials & In-depths » This topic
IAS EXPRESS Vs UPSC Prelims 2024: 85+ questions reflected
The Laffer Curve, a concept popularized by economist Arthur Laffer, illustrates the relationship between tax rates and government revenue, suggesting that there is an optimal tax rate that maximizes revenue. Recent discussions, such as those surrounding Donald Trump’s tax policies and debates in the UK, highlight its continued relevance and controversy. Critics argue that while tax cuts can theoretically boost revenue, empirical evidence often shows mixed results, particularly in varying economic contexts.

Theoretical Foundations
Basic Concept
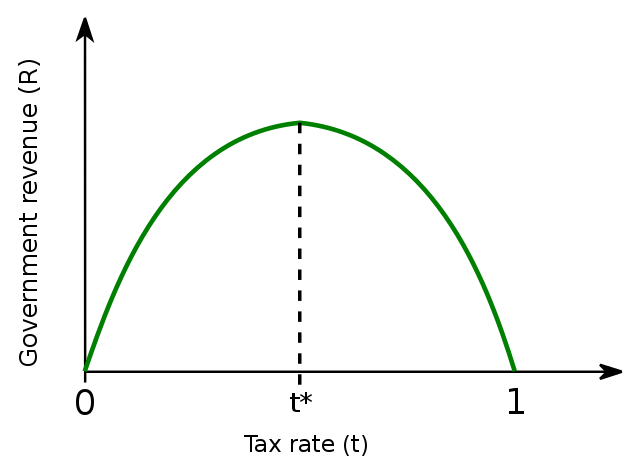
- Relationship Between Tax Rates and Tax Revenue
- The Laffer Curve illustrates the relationship between tax rates and the resulting government tax revenue. It posits that there is an optimal tax rate that maximizes revenue.
- Graphical Representation: Inverted U-Shape
- The curve is typically depicted as an inverted U-shape, indicating that revenue increases with tax rates up to a certain point, after which further increases in tax rates lead to a decline in revenue.
Underlying Assumptions
- Taxable Income Elasticity
- The concept relies on the elasticity of taxable income, which measures how taxable income responds to changes in tax rates. Higher elasticity implies significant changes in taxable income with tax rate adjustments.
- Behavioral Responses to Tax Changes
- It assumes that individuals and businesses alter their behavior in response to tax changes. For instance, higher tax rates might discourage work or investment, while lower rates might encourage economic activity.
Mathematical Derivation
- Rolle’s Theorem and Its Application
- Rolle’s Theorem is used to justify the curvature properties of the Laffer Curve. It states that if a function is continuous and differentiable, and it crosses the x-axis at two points, there must be at least one point between them where the derivative (slope) is zero.
- General Equilibrium Models
- The Laffer Curve can be derived from general equilibrium models that consider the entire economy. These models account for the interactions between different economic agents and markets, providing a comprehensive framework for understanding the curve’s implications.
Historical Context and Applications
Early Examples and Theoretical Antecedents
- Ibn Khaldun’s Writings
- Ibn Khaldun, a 14th-century Arab philosopher, discussed the relationship between tax rates and tax revenue in his work Muqaddimah. He observed that at the beginning of a dynasty, low tax rates yielded high revenue, while at the end, high tax rates resulted in low revenue. This early concept aligns with the principles of the Laffer Curve.
- John Maynard Keynes’ Observations
- John Maynard Keynes, a prominent 20th-century economist, acknowledged the idea that excessively high tax rates could reduce tax revenue. He argued that lowering taxes could potentially increase revenue by stimulating economic activity, a notion that prefigures the Laffer Curve.
The Reagan Administration
- Tax Cuts and Economic Policies
- During the 1980s, President Ronald Reagan implemented significant tax cuts based on the principles of the Laffer Curve. The Economic Recovery Tax Act of 1981 reduced the top marginal tax rate from 70% to 50%, aiming to boost economic growth and increase tax revenue.
- Outcomes and Controversies
- The outcomes of Reagan’s tax policies are debated. Proponents argue that the tax cuts spurred economic growth and increased tax revenue, while critics contend that they led to higher deficits and income inequality. The controversy lies in the difficulty of isolating the effects of tax cuts from other economic factors.
Empirical Evidence and Criticisms
Empirical Studies and Findings
- Revenue-Maximizing Tax Rates
- Various empirical studies have attempted to identify the revenue-maximizing tax rates. These studies often find that the optimal tax rate for maximizing revenue varies significantly, typically falling between 30% and 70%. The exact rate depends on numerous factors, including the specific economic context and the structure of the tax system.
- Variability Across Economies
- The effectiveness and shape of the Laffer Curve can differ widely across different economies. Factors such as the level of economic development, the existing tax structure, and the elasticity of taxable income all contribute to this variability. For instance, developed countries might have different optimal tax rates compared to developing countries due to differences in economic behavior and tax compliance.
Criticisms and Limitations
- Oversimplification of Tax Systems
- One major criticism is that the Laffer Curve oversimplifies complex tax systems. Real-world tax systems include multiple tax rates and brackets, deductions, credits, and other factors that the simple Laffer Curve model does not account for. This simplification can lead to misleading conclusions about the effects of tax rate changes.
- Assumptions of Single Tax Rate
- The Laffer Curve often assumes a single tax rate for the entire economy, which is rarely the case in practice. Most tax systems have progressive tax rates, where different income levels are taxed at different rates. This assumption can distort the analysis and its applicability to real-world scenarios.
- Issues of Tax Avoidance and Evasion
- High tax rates can lead to increased tax avoidance and evasion, reducing the actual tax revenue collected. This behavior is not always adequately captured in Laffer Curve models, which can overestimate the revenue-maximizing tax rate. Taxpayers may engage in legal tax planning or illegal evasion to minimize their tax liabilities.
- Non-Monetary Factors: Social Equity and Environmental Sustainability
- The Laffer Curve primarily focuses on monetary outcomes and does not consider non-monetary factors such as social equity and environmental sustainability. High tax rates might be justified to achieve greater income equality or to fund environmental initiatives, even if they do not maximize revenue. Ignoring these factors can lead to policies that are economically efficient but socially or environmentally detrimental.
Case Studies
United States
- Historical Tax Policies and Laffer Curve Applications
- The Laffer Curve gained prominence during the Reagan administration in the 1980s. Reagan’s tax cuts, based on Laffer’s principles, aimed to reduce the top marginal tax rate from 70% to 50%. The goal was to stimulate economic growth and increase tax revenue by encouraging investment and work.
- Earlier applications include the 1920s tax cuts under Treasury Secretary Andrew Mellon, who argued that lower tax rates would increase revenue by boosting economic activity. These policies were based on the idea that high tax rates discourage income generation and investment.
- Recent Tax Reforms and Their Impacts
- The Tax Cuts and Jobs Act (TCJA) of 2017 is a recent example of Laffer Curve principles in action. The TCJA reduced the corporate tax rate from 35% to 21% and made significant changes to individual tax rates. The reform aimed to stimulate economic growth by increasing disposable income and encouraging business investment.
- The impacts of the TCJA have been mixed. While there was an initial boost in economic activity and corporate investment, the long-term effects on revenue and economic growth are still debated. Critics argue that the tax cuts have significantly increased the federal deficit without proportionate revenue gains.
European Union
- Comparative Analysis of Tax Policies
- The European Union presents a diverse landscape of tax policies, with significant variations in tax rates and structures among member states. Countries like Sweden and Denmark have high tax rates but also high levels of public services and social welfare, which influence their economic outcomes.
- Estonia is often highlighted for its competitive tax system, featuring a flat tax rate and a territorial tax system that exempts foreign profits from domestic taxation. This system is designed to attract investment and promote economic growth.
- Revenue Outcomes and Economic Growth
- Empirical studies in the EU show that countries with lower corporate tax rates and simplified tax systems tend to attract more foreign direct investment (FDI) and experience higher economic growth. However, the relationship between tax rates and revenue is complex and influenced by various factors, including economic structure and compliance levels.
- The European Tax Policy Scorecard evaluates the competitiveness and neutrality of tax systems across EU countries. It finds that well-structured tax codes, which minimize economic distortions and maintain low marginal tax rates, are more effective in promoting sustainable growth and raising sufficient revenue.
The Laffer Curve in India
Historical Context
- Tax Policies Pre- and Post-Economic Reforms
- Before the economic reforms of 1991, India had a highly progressive tax system with very high marginal tax rates. For instance, during the 1970s, the highest marginal tax rate reached an astonishing 97.5%. These high rates were intended to promote income equality but led to widespread tax evasion and a narrow tax base.
- Post-1991 economic reforms, led by Finance Minister Dr. Manmohan Singh, significantly reduced tax rates and simplified the tax structure. The reforms aimed to broaden the tax base, reduce evasion, and stimulate economic growth. The highest marginal tax rate was brought down to 30%, aligning more closely with global standards.
- Evolution of Income Tax Rates
- Over the decades, India’s income tax rates have undergone numerous changes. Initially, the tax system was highly complex with multiple slabs and high rates. The 1980s and 1990s saw a gradual reduction in the number of tax slabs and the marginal tax rates.
- The introduction of the Goods and Services Tax (GST) in 2017 marked a significant shift in indirect taxation, aiming to unify the tax structure across the country and reduce the cascading effect of multiple taxes.
Empirical Analysis
- Studies on Optimal Tax Rates for India
- Empirical studies have attempted to identify the optimal tax rates that maximize revenue without discouraging economic activity. These studies often use Laffer Curve analytics to determine the point at which tax rates start to negatively impact revenue.
- Research indicates that moderate tax rates are more effective in maximizing revenue and compliance. Excessively high rates tend to erode the tax base as individuals and businesses seek ways to avoid or evade taxes.
- Impact of Tax Evasion and Informal Economy
- Tax evasion remains a significant challenge in India, exacerbated by the large informal economy. High tax rates and complex regulations have historically driven many economic activities underground.
- Efforts to curb tax evasion include the implementation of the GST, which aims to bring more transactions into the formal economy, and the use of technology to improve tax administration and compliance.
Policy Implications
- Recent Tax Reforms and Their Outcomes
- Recent tax reforms, such as the reduction in corporate tax rates and the introduction of the new personal income tax regime, aim to simplify the tax system and make it more competitive. The new regime offers lower tax rates but removes most exemptions and deductions.
- These reforms have had mixed outcomes. While they have simplified compliance for some taxpayers and potentially increased disposable income, the overall impact on revenue and economic growth is still being evaluated.
- Future Directions for Tax Policy
- Future tax policy in India is likely to focus on further simplifying the tax structure, broadening the tax base, and improving compliance. This includes leveraging technology for better tax administration and continuing efforts to integrate the informal economy into the formal sector.
- Policymakers may also explore adjustments to GST rates and slabs to ensure they are aligned with optimal tax principles, balancing revenue generation with economic growth and equity considerations.
The Laffer Curve’s application in India underscores the importance of balancing tax rates to maximize revenue while fostering economic growth. Historical shifts from high, complex tax structures to more simplified, moderate rates post-1991 reforms have shown mixed results. Empirical studies advocate for moderate rates to enhance compliance and revenue. Future tax policies will likely focus on further simplification, leveraging technology, and integrating the informal economy to achieve sustainable economic development.
Practice Question
Discuss the relevance and application of the Laffer Curve in shaping India’s tax policies, considering historical contexts, empirical evidence, and future policy directions. (250 words)
If you like this post, please share your feedback in the comments section below so that we will upload more posts like this.